Ultra-High-Net Worth (UHNW) Giving Guidance

“How much should I be giving?”
This recent question from a member of the Ultra-High Net Worth (UHNW) community gave Giving Place and FOX the chance to collaborate on what the data says and how we can interpret it to support community members.
Giving is always a personal decision, depending on factors such as means, motivation, and opportunity. Even more considerations exist when thinking about giving in a UHNW context, many more than a typical donor might face. For this group, decisions about what, how much, and when to give take on additional challenges – and offer considerable opportunity.
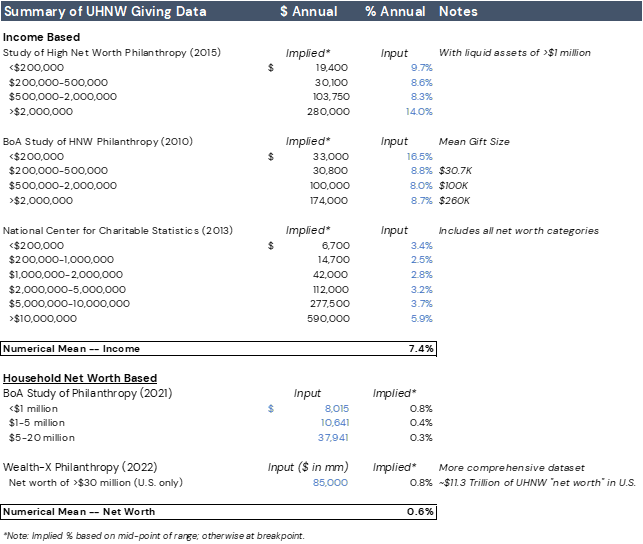
When looking for an answer to the specific question posed, we found that there are few comprehensive studies or clear benchmarks on giving guidance for UHNW individuals and families, which we define as a net worth of >$30 million (Imberg et al., 2022). Based on several reputable studies conducted over the last 10-15 years, we can triangulate around a numerical mean of ~7.4% of household income and 60 bps (~0.6%) of net worth as a reasonable proxy for annual UHNW giving.[1]
With data from FOX research, we can offer an additional layer of insight and potential validation. While we cannot make a comparison at the household income level, we can look at our asset numbers and use additional research to attempt to validate the above estimates.
If we apply the estimate of giving as .6% of net worth to FOX’s 2022 median asset level of $560 million, we will end up with an annual giving rate of just over $3 million. In 2022, a FOX study asked about annual giving – and found that one-third of participants were at this rate, with another quarter between $1-$3 million. While not a hard and fast rule and hardly at the level of statistical significance, these findings may lend credence to the calculations and give us a jumping-off point for deeper exploration and best practices discussions with the community.
In the end, looking at the numbers is a theoretical exercise that provides one perspective on an optimal giving number. When considering how – and how much – an individual should give, UHNW individuals and their advisors would typically consider the following variables:
- Client/family net worth
- Client/family annual income (including invested assets cash flow/dividends)
- Family operating business revenue and cash flow
- Expected investment returns
- Tax efficiency targets
- Lifestyle funding needs
- Next Generation wealth transfer considerations
- Possibility of a liquidity event or other major influx of capital
- Desired (or required) “spending rate” and spend-down plans for allocated philanthropic capital
- Faith traditions and personal values or philanthropic goals
Perhaps because giving numbers are so unique to each individual's situation, the best call to action we can offer because of this exploration is to ask, “Do you know your numbers – both what you give and where it goes?” If not, consider the following steps:
- With tax season upon us, we are already collecting the necessary documentation. This makes it an ideal time to look at your prior year’s giving – both the amount and where you gave. Did anything surprise you? Did you achieve what you wanted to with your giving?
- If you have never done an exploration into your philanthropic priorities and if or how your giving reflects those priorities, this is a great time to get started (because you have all the documentation, at least for last year).
- If you are ready to take the next steps, reach out! Many great resources, advisors, and tools can assist you and your family in taking that giving to the next level – wherever that level might be.
[1] Please see the appendix and references for a full list of studies used in this estimate.
APPENDIX
Summary of High-Net-Worth Studies
Studies cited
Osili, U., Clark, C., & Bergdoll, J. (2021). The 2021 Bank of America study of philanthropy: Charitable giving by affluent households. Bank of America & the Indiana University Lilly Family School of Philanthropy. https://scholarworks.iupui.edu/bitstream/handle/1805/26654/bank-america-sept21.pdf?gclid=deleted
Pasic, A., Rooney, P., Osili, U., Clark, C., Claire, M., Bergdoll, J. (2016). The 2016 U.S. Trust® study of high net worth philanthropy: Charitable practices and preferences of wealthy households. U.S. Trust & the Indiana University Lilly Family School of Philanthropy. https://scholarworks.iupui.edu/bitstream/handle/1805/11234/high-net-worth_oct_2017-1.pdf?sequence=4
Osili, U., Bhakta, R., Brown, M., Hirt. D., Hyatte, C., Raghavan, S., Kou, X., Small, J., & Neumeyer, S. (2010). The 2010 study of high net worth philanthropy: Issues driving charitable activities among affluent households. Bank of America Merrill Lynch & the Center on Philanthropy at Indiana University. https://scholarworks.iupui.edu/bitstream/handle/1805/5666/2010baml_highnetworthphilanthropy.pdf?sequence=1&isAllowed=y
Imberg, M., & Shaban, M. (2022). Ultra high net worth philanthropy 2022. Wealth-X. https://go.wealthx.com/download-ultra-high-net-worth-philanthropy-report-2022
Financial Samurai. (2022), The average percent of income donated to charity can improve. Financial Samurai. https://www.financialsamurai.com/the-average-percent-of-income-donated-to-charity/