Market Volatility Reigns

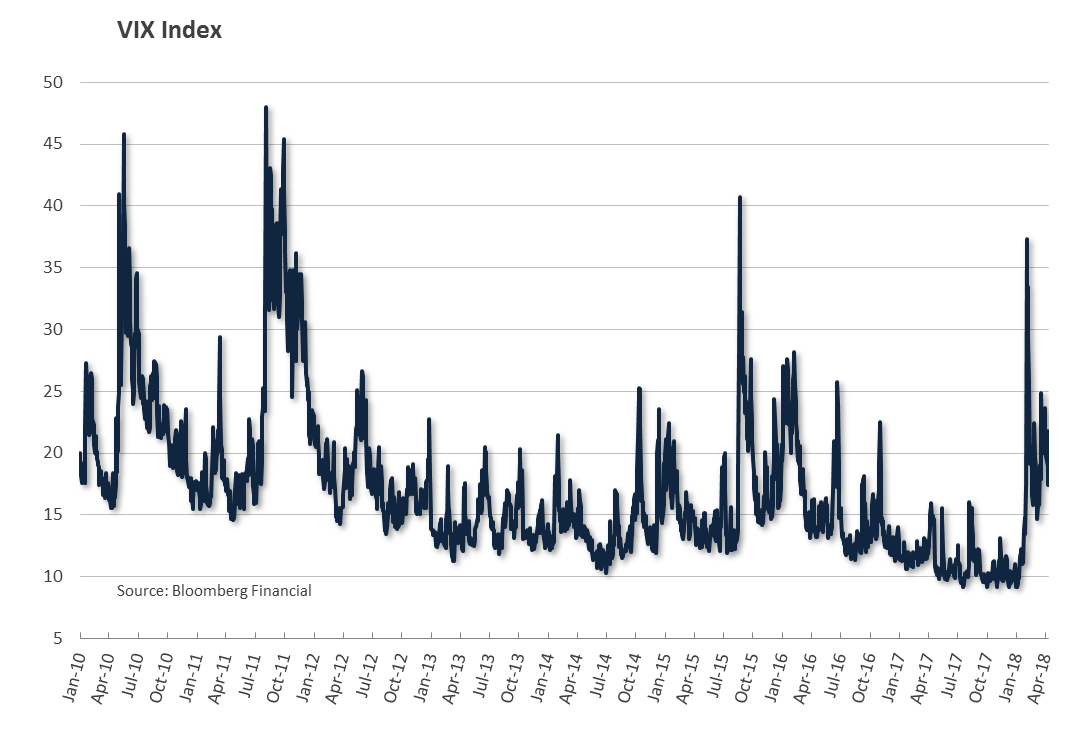
What a difference a year makes. Trade war predictions, Facebook data scandals, inflation concerns and Federal Reserve comments have been whipsawing markets in the first few months of 2018. As a testament to the increased turbulence, through mid-April we had already notched 28 trading days that resulted in a greater than 1% move from the previous S&P 500 close. Compare this to the 8 such instances seen in all of 2017, and the regime change becomes clear (see Exhibit #1).
Exhibit #1
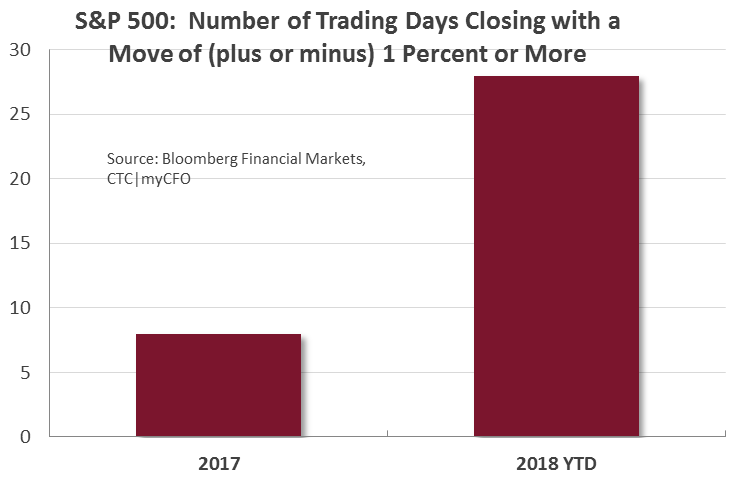
In the context of history, extended periods of volatility are the norm after events such as the chaotic break seen in early February. Indeed after the VIX spikes of 2010, 2011, and 2016 the average number of trading days until the 30-day moving average of the VIX returned to the pre-spike daily VIX level was around 100 days (median 121 days). By the end of April, we will reach trading day number 64 since the VIX spike on February 5 (see Exhibit #2). Based on precedent of the past several years, we should be about half way through the volatility, but actual resolution will be greatly influenced by trade and tariff standoff between the U.S. and China. It is important for investors to understand and brace for this potential persistence of volatility. In such environments, a news story or economic data point can have an outsized effect on the markets in either direction relative to more tranquil periods.
Exhibit #2